How scientists learned to see it coming
A failed monsoon triggered the Great Famine of 1876-1878, which killed an estimated 5-10 million people in India. The tragedy sent officials in the British Raj into a frenzy, and the Indian Meteorological Department was tasked with preparing a seasonal forecast of the Southwest Monsoon rains. At that time, IMD had to make do with informal data, like Himalayan snowfall levels, but none of it was statistically rigorous. A second monsoon failure and famine in 1899 only increased pressure on the department.
In 1904, the department brought in Sir Gilbert Walker, a Cambridge-trained mathematician, as the director general of observatories in colonial India. He inherited the bleak assignment of explaining why the monsoons kept failing year after year. He dove right into the mountain of data – decades of atmospheric pressure records from weather stations scattered across the globe. When he wasn’t standing on Simla’s Annandale grounds throwing boomerangs (he was called “Boomerang Walker” during his university years) or peering at birds through his telescope, he ran complex analyses of atmospheric pressure, rainfall, river levels, snowpack, and even sunspot activity, trying to make sense of the numbers.
Slowly, a pattern emerged. He noticed that when atmospheric pressure was high over the Pacific, it tended to run low over the Indian Ocean, and vice versa, as if the two oceans on opposite sides of the planet were see-sawing. He called it the Southern Oscillation. While he suggested that ocean circulation and temperatures might play a role in driving this oscillation, he couldn’t figure out the physical mechanism, primarily due to a lack of data from the oceans. As a result, his theory was met with scepticism by most meteorologists of his time.
Meanwhile, a seemingly unrelated pattern had been wreaking havoc in the lives of Peruvian fishermen on the other side of the globe for centuries. The cold, nutrient-rich current that usually fed their catch would, during some years, give way to warm, nutrient-poor water, gutting fishing for months at a stretch. They called it El Niño de Navidad (the “Christ Child,” as the warming usually peaked around Christmas).
It wasn’t until the 1960s, when Norwegian-American meteorologist Jacob Bjerknes started looking at real-time temperature readings from a weather station on Canton Island in the Pacific Ocean, that a link between El Niño and the Southern Oscillation emerged. Bjerknes determined that Walker’s pressure seesaw moved in lockstep with sea-surface temperature: warm water in the eastern Pacific meant low pressure; cool water meant high pressure. Bjerknes called the underlying engine the Walker Circulation. He showed that Walker’s Southern Oscillation and El Niño were two parts of the same coupled ocean-atmosphere system – the phenomenon scientists now call ENSO.
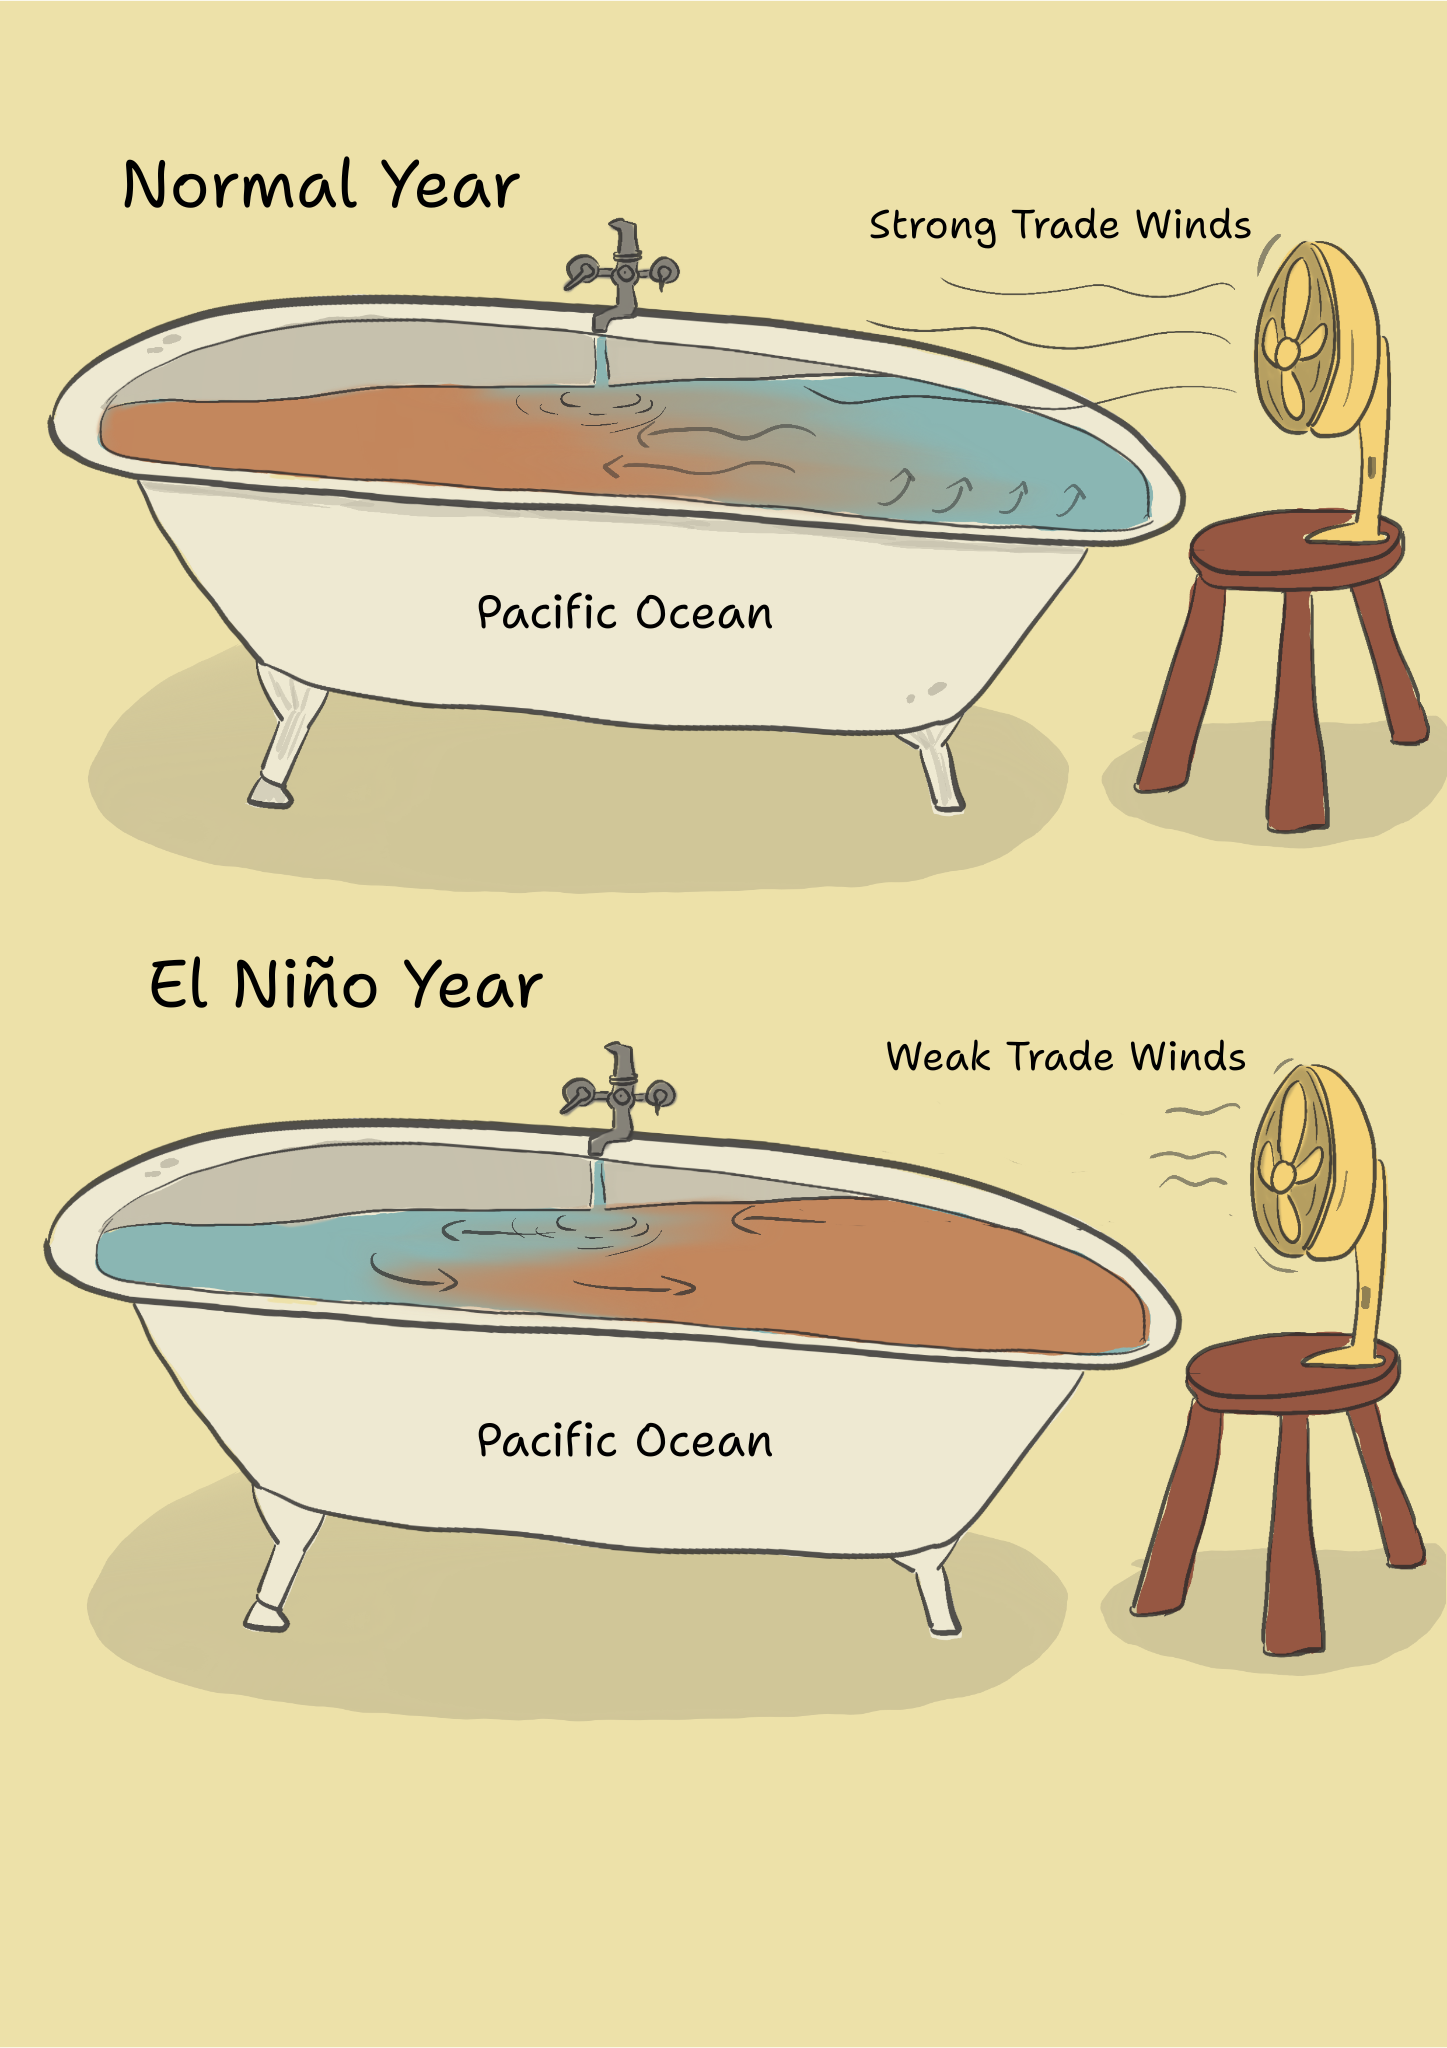
ENSO occurs when the east-to-west equatorial trade winds weaken, causing warm Pacific water that would normally pile up near Asia to slosh back east, shutting off the expected cold upwelling near South America. The ocean and the atmosphere, it turns out, are co-culprits.
ENSO has been stirring up trouble for thousands, if not millions of years. Paleoclimate records point to warmer seas and heavier rains stretching back to the last ice age. Some historians have linked the phenomenon to the collapse of ancient civilisations like the Moche and the Inca, and even to the European crop failures that led to the French Revolution in 1788-89. At least three catastrophic famines in the late 19th century struck India in years now recognised as major El Niño events. Nobody knew at the time that a patch of warm water thousands of miles away was steering their weather.
That has somewhat changed over the last century. Scientists have spent decades seeking an explanation for a pattern that, for most of human history, manifested in a ruined harvest here or empty fishing nets there. By the late 20th century, they figured out the cause and mechanisms. But what they couldn’t yet find was a way to watch it happen in real time and predict its occurrence. That gap became painfully clear in 1982.
Seeing through smoke
On 4 April 1982, Mexico’s El Chichón volcano erupted, hurling ash and sulphur dioxide high into the stratosphere. It could not have picked a worse moment. Thousands of miles away, across the tropical Pacific, an enormous El Niño was already beginning to build. El Chichón’s plume drifted straight into the path of the few satellite instruments capable of tracking the El Niño, scrambling their readings of sea-surface temperature and forcing them, quite literally, to see through the smoke.
The El Niño of 1982–83 ended up being the field’s founding trauma. Numbers failed to capture the full scale of devastation. Parts of coastal Peru, where the norm was six inches of rain per year, received close to 11 feet. Coastal rivers reportedly carried a thousand times their usual flow, and near the fishing village of Paita, sea-surface temperature jumped more than 7°F in a single day. Australia, Indonesia, and southern Africa went the opposite way, battered by drought, dust storms, and bushfires. In the eastern Pacific, some reefs lost up to 95% of their coral. The human toll was roughly 1,300 to 2,000 deaths worldwide, with property and livelihood losses close to $4 trillion. The US National Oceanic and Atmospheric Administration (NOAA) would later describe the event as one that was “neither predicted nor detected until nearly at its peak.”
‘The 1982-83 El Niño event was a revelation that we needed better observing systems in the tropical Pacific’
All of it traced back to a shift in ocean temperature that, at the time, almost nobody had the instruments in place to see coming. Satellites had only just begun providing regular ocean coverage, and much of the tropical Pacific was still monitored, if at all, by whichever ships happened to be passing through.
“1982-83 was a revelation that we needed better observing systems in the tropical Pacific,” says Michelle L’Heureux, who leads the ENSO team at NOAA’s Climate Prediction Centre. “The event exposed the lack of real-time observations in the tropical Pacific and led to major investments in ocean observations,” adds Roxy Koll, a climate scientist at the Indian Institute of Tropical Meteorology, Pune.
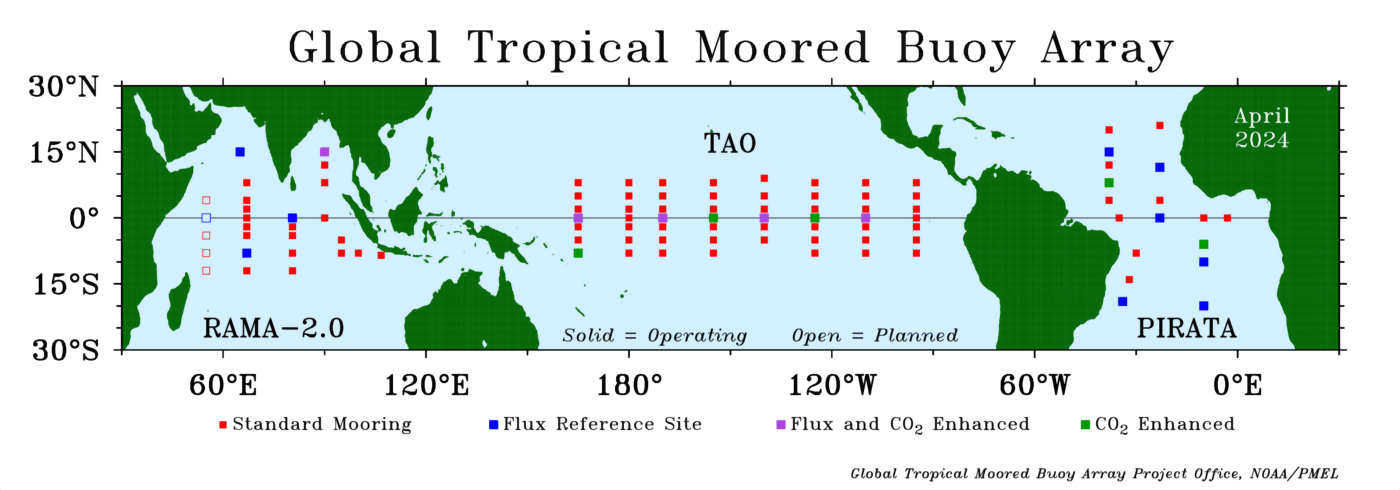
The Tropical Ocean Global Atmosphere (TOGA) programme, a decade-long international research effort, was founded in 1985. Its centrepiece: the TAO/TRITON array.
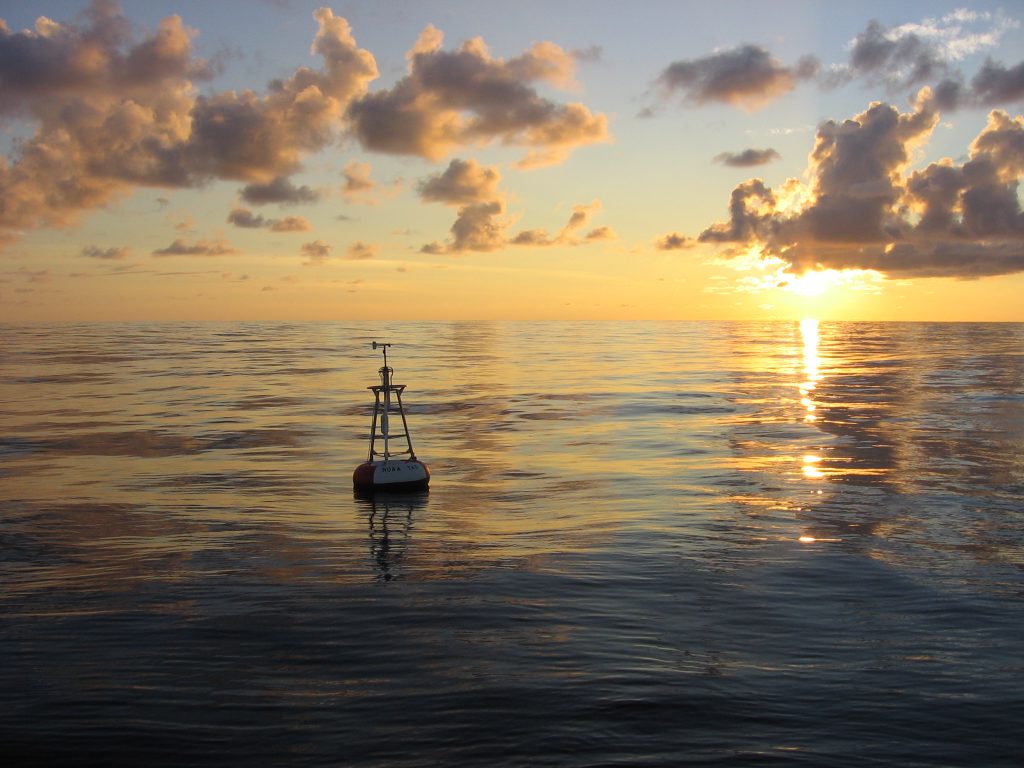
Unlike the drifting Argo floats that would come decades later, the TAO buoys were fixed in place along the equatorial Pacific, providing a concentrated, unblinking watch over the one stretch of ocean that mattered most. A standard buoy has a two-metre fibreglass ring with an aluminium mast anchored to the seafloor and trailing a 500-metre cable with temperature sensors at 10 different depths. Wind, humidity, air temperature, and sea-surface temperature are read off instruments on the mast. Several times a day, the data is beamed to satellites and relayed to shore stations, where it becomes publicly available within hours.
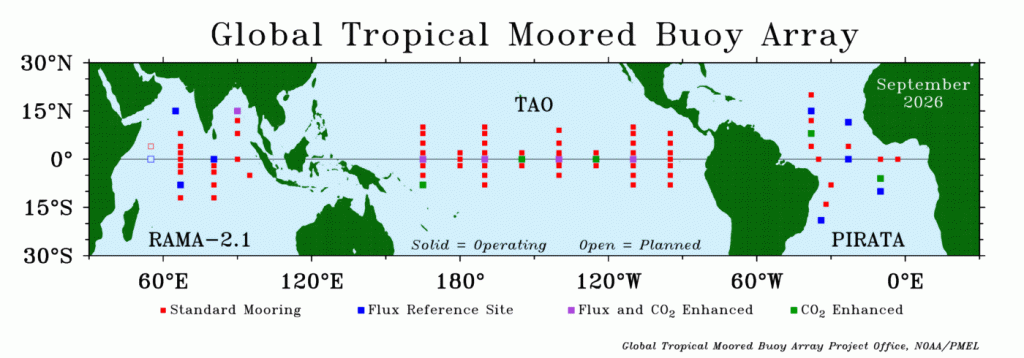
The buoys were built to answer a question that satellites fundamentally couldn’t. “Satellites cannot see the subsurface temperature or the bottom of the ocean,” explains Arindam Chakraborty, Professor at the Centre for Atmospheric and Ocean Sciences (CAOS), IISc. “So, people have put sensors that go deep into the ocean.”
Once the TOGA-Coupled Ocean-Atmosphere Response Experiment (TOGA-COARE, as it was called) got underway a few years later, its sensors were able to pick up a slow eastward crawl of unusually warm water along the equator, weeks or months before it ever reached the surface – pulses now known as equatorial Kelvin waves. A thermistor reading warmer than normal – partway down that cable, long before anything changes at the surface – became the “subsurface heat signal” that would, decades later, turn into the most trusted early-warning sign of an impending El Niño.
Patterns to physics
Sometime in the mid-1980s, over a Fourth of July weekend, American oceanographer Mark Cane sat by a lake reading a paper which claimed that El Niño could be predicted by tracking the depth of the thermocline – the horizontal boundary between warm surface water and the colder water beneath – in the far western tropical Pacific.
A decade earlier, oceanographer Klaus Wyrtki had proposed that El Niño was preceded by an unusual buildup of warm water in the western Pacific. When the trade winds relaxed, he argued, the stored water could surge eastward, depressing the thermocline and heating up surface waters off South America. In 1974, Wyrtki and his colleagues even attempted to put the idea to the test: after an El Niño was forecast for early 1975, they organised an oceanographic expedition to watch the Pacific as the event developed. The warming appeared, but quickly fizzled out.
By the time Cane encountered that paper, scientists had begun to suspect that the ocean’s depths might contain clues to an El Niño before it appeared at the surface. Cane, a Brooklyn-born applied mathematician trained under renowned meteorologist Jule Charney at MIT, wasn’t convinced. But it raised an interesting question: Could the thermocline still be hiding a realistic early warning sign, for reasons that the paper’s author hadn’t yet identified? Cane and his student, Stephen Zebiak, had a hunch about what that sign could be. In the coupled ocean-atmosphere feedback that Bjerknes had described, a change in trade winds pushes warm water east, which should, in turn, reshape the thermocline across the whole Pacific basin – meaning that its depth wasn’t just a symptom of El Niño, but potentially an early signal of one building up.
That hunch didn’t come out of nowhere. For several years already, Cane and Zebiak had been building one of the world’s first coupled ocean-atmosphere computer models capable of simulating ENSO. The model divided the Pacific Ocean into a grid, tracking wind, sea surface temperature, and ocean currents in each square. It used mathematical equations to predict how these three push and pull each other – for example, warm water reshaping wind movement and vice versa – and mimic how ENSO conditions unfold. Unlike the statistical forecasts that dominated seasonal prediction at the time, it didn’t scan historical records for recurring patterns; it encoded the actual physics (movement, properties) of ocean-atmosphere interaction and let ENSO conditions emerge from that alone. Cane and Zebiak’s goal at first was simply to find out if the physics by itself, with no help from historical statistics, could simulate ENSO patterns.
As it turned out, left to run with no historical event programmed in, the model fell into a repeating warm-cool cycle that looked unmistakably like real ENSO. The obvious next question was whether the same equations could calculate what would happen next. When Cane and Zebiak tried exactly that, the model produced a striking result: an El Niño appeared likely to develop in 1986.
“In that first stage, we were just out to simulate ENSO,” Cane later recalled in an interview published in National Science Review in November 2018. “We weren’t even thinking about prediction.”
They took the forecast to the director of Columbia University’s Lamont-Doherty Earth Observatory, and after scrutiny, it was cautiously approved for release. In 1986, the team published the forecast in Nature and, in a move unusual for climate scientists at the time, held a press conference to explain it publicly.
The forecast proved largely correct, and for the first time, a physics-based model had anticipated an El Niño before it fully emerged.
Seasonal forecasting was still a young science, and the tropical Pacific had a habit of humbling those who claimed too much certainty
Yet one successful prediction was not enough to convince everyone. Seasonal forecasting was still a young science, and the tropical Pacific had a habit of humbling those who claimed too much certainty. It would take another decade – and another giant El Niño – before forecasting moved from an intriguing experiment to an accepted scientific capability.
That test arrived in 1997.
“The 1997-98 event was relatively well predicted,” says Michelle. “We saw it coming well in advance of its impacts.” Across the USA, winter temperatures and rainfall lined up closely enough with the forecast that agencies and governments could plan around it in advance.
But the triumph masked a harder truth. Forecasting an El Niño was becoming easier. Forecasting what it would do remained difficult. “I would argue that all the El Niño events since then have been a bit less predictable than 1997-98,” Michelle says. “We now appreciate that you can get a wider variety of possible outcomes than suggested by the forecast success of 1997-98.”
Every event since has uncovered new surprises. In 1999, another player entered the scene: the Indian Ocean Dipole, a seesaw of warming and cooling between the eastern and western Indian Ocean (see box), which scrambled what had looked like a clear link between El Niño and a weak Indian monsoon. That complication turned out to be the pattern of the following decades: every clean signal that the field found came bundled with new sources of noise.
The Indian Ocean Dipole
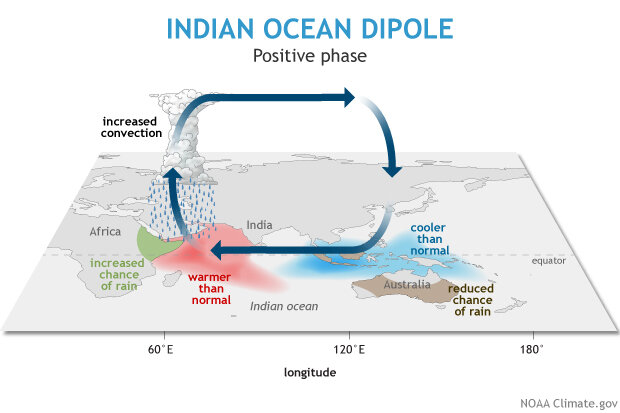
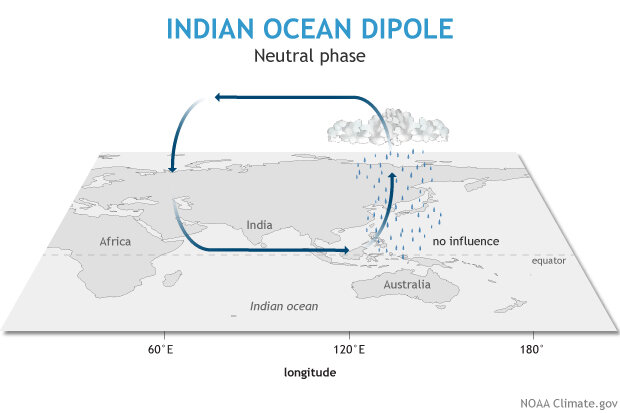
For a while, Indian forecasters saw a correlation between El Niño and the monsoon: warm Pacific meant weak monsoon and therefore drought. Then, in 1999, a team of scientists – NH Saji, BN Goswami, PN Vinayachandran, and T Yamagata, publishing in Nature – identified a second player that had been hiding in plain sight. The Indian Ocean Dipole (IOD) is a seesaw of warming and cooling between the western and eastern Indian Ocean, typically peaking around July through September – right in the middle of monsoon season.
In its “positive” phase, warm water pools in the west while the waters off Sumatra turn unusually cool, and depending on how that lines up with what the Pacific is doing, it can blunt El Niño’s usual drying effect on India or sharpen it considerably. “This was a new discovery … that completely alters the impact El Niño may have on the Indian monsoon,” says J Srinivasan, Honorary Professor at CAOS, IISc. It’s part of why the strong El Niño of 1997 never produced the drought that the old playbook predicted. The Pacific was pulling one way, and the Indian Ocean – for reasons nobody had thought to look for yet – was quietly pulling another. Even now, scientists like Arindam are careful not to oversell how well understood that tug-of-war is.
(Image courtesy: NOAA Climate.gov)
Building better machines
In 2002, India’s statistical models called for a near-normal monsoon. Instead, the rains failed catastrophically partway through the season. “We got one of the most severe droughts,” says Ravi Nanjundiah, Professor at CAOS, who has worked closely with India’s forecasting agencies. “Models, not just in India but all over the world, were not able to catch it.”
Every part of the seasonal forecasting system came under scrutiny, leading to a series of incremental improvements to observations, model resolution, computing power, and forecasting methods.
A seasonal forecast, unlike a weather forecast, was never meant to say exactly what will happen on a given day. It’s a statement about shifted odds: Given how the Pacific looks right now, is a weak monsoon over central India more or less likely than usual this year? Getting those odds right, and getting better at stating them confidently, became the real goal for the next two decades.
Model resolution was one of the first targets. Adam Scaife, Principal Fellow and Head of Monthly to Decadal Prediction at the UK Met Office, compares the change to the pixels on a digital photograph. The ocean models of the early 2000s carved the Pacific into blocks roughly 100 km wide, coarse enough to blur out entire ocean currents. Today’s models run at a quarter of that size – blocks closer to 25 km wide – fine enough to resolve features like the Gulf Stream that used to simply vanish into the average.
Alongside the models, the monitoring network continued to expand. The Argo programme, launched in the early 2000s, scattered thousands of autonomous floats across the world’s oceans – diving down about two kilometres and back every 10 days, measuring temperature and salinity as they went. They filled the gaps in the vast stretches of open ocean that the TAO buoys, tied to the equator, couldn’t cover.
The other shift was less visible but arguably more important. Scientists stopped pretending that forecasting had a single right answer. Instead of running one simulation and calling it a forecast, weather agencies began running and digesting data from dozens simultaneously. “We [now] do about 50 such simulations to give you a single forecast,” says Ravi. Outside the tropics, where the atmosphere is less noisy and El Niño’s influence is more diffuse, Adam’s group has found that even that isn’t quite enough. “You really need 50 or even 100 forecasts to see what’s actually happening,” he says.
What actually matters, says Roxy, is not just a single reading but the dialogue between them. “A surface warming in the central-east Pacific becomes more consequential when the atmosphere responds, because that is when El Niño begins to influence tropical rainfall and circulation more broadly.”
Still, none of this makes forecasting certain. “It’s so, so important to communicate uncertainty,” says Michelle. “We cannot tell you that there will be a 100% chance of some outcome due to El Niño, but we can tell you the odds of such an outcome.” NOAA’s Climate Prediction Centre puts out a formal discussion every month. As the 2026 El Niño developed, the July discussion read: “El Niño continues and will strengthen through the end of the year, with a 97% chance it will persist through early spring 2027.” This means that for this winter, NOAA’s seasonal outlook favours wetter-than-normal conditions across much of the southern USA and above-normal temperatures across much of the West – “favours” being the operative word, not “guarantees.” Instead of absolute certainty, it provided a forecast close enough to it that farmers, water managers, and governments can plan around it.
Srinivasan explains why communicating this uncertainty clearly matters. In 2015, with an El Niño developing much like this year’s, the IMD predicted a drought. But by late August, rainfall was tracking normal, and the drought was nowhere in sight. At a meeting in August, Srinivasan recalls, the Prime Minister asked the Secretary of the Ministry of Earth Sciences why the forecast was wrong. “Immediately after the meeting, the monsoon started going down, and from August and September, the monsoon was so bad that we had a drought,” Srinivasan says. The forecast hadn’t failed; it had just been early. “Monsoon can be quite surprising,” he says, with resigned amusement.
Today, scientists are quick to point out what forecasting still can’t account for. Chief among them is the spring predictability barrier (see box), a blind spot that has frustrated researchers for decades and one that Michelle does not expect to disappear anytime soon. “It may be one of those intractable issues we may not ever completely overcome,” she says.
The Spring Predictability Barrier
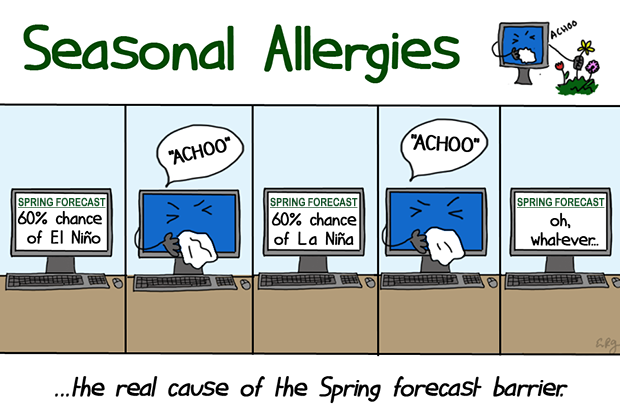
Every spring, ENSO forecasts get noticeably less reliable, no matter how good the models are or how much data is fed into them. Around March and April, the tropical Pacific is transitioning between phases, and the signals that forecasters lean on the rest of the year – subsurface heat, trade wind strength, sea-surface temperature – are at their weakest and noisiest. A forecast issued in February can call the coming summer with real confidence. But the one issued in April is often still guesswork. It’s not a data or a computing problem; it’s built into the physics of the season itself – the ocean genuinely is harder to read at that specific point in its yearly cycle for everyone, regardless of how good their tools are. This spring predictability barrier has stumped scientists for decades.
In 2024, Arindam’s group finally found a workaround. They were studying decade-scale cycles in Indian rainfall and surface pressure when they noticed a distinct pattern of variability in sea-level pressure over the southern Pacific Ocean that shows up every spring – right in the dead zone of the barrier. They call it the ENSO Transition Mode, or ETM. “It is not the primary mechanism that develops an ENSO,” Arindam says, “but it helps the development.” When that spring pressure signal runs stronger than usual, it can make a developing El Niño stronger or a developing La Niña weaker. Arindam is careful to call it a contributing factor, not a cause, but it gives forecasters something real to weigh in on, right in the exact months when the usual signals go quiet. The discovery is now one of the few tools chipping visible cracks in a barrier that was assumed to be unbreakable.
(Illustration courtesy: Emily Greenhalgh, NOAA Climate.gov)
Some uncertainties arise from the climate system itself. Others stem from a more unsettling possibility: the phenomenon that scientists are trying to forecast is no longer the same one their predecessors learned from.
As oceans warm up and marine heatwaves become more common, researchers have begun asking whether El Niño itself is changing – or whether only its impacts are. “A lot of work has been done to understand how global warming affects El Niño,” says Srinivasan. “But unfortunately, there is no consensus.” Adam draws the same distinction. He is confident that El Niño’s consequences are becoming more severe because they are unfolding on a warmer planet, but he is far less certain that the phenomenon itself is changing. “We’re not 100% sure about that,” he says. “We don’t have full agreement between all the computer models.”
The uncertainty is not merely academic. For more than a century, El Niño and La Niña have been measured against a historical baseline – an assumption about what constitutes “normal” conditions in the tropical Pacific. But as the oceans steadily warm up, that baseline itself is beginning to shift. Michelle says that researchers are increasingly grappling with the possibility that today’s events have to be measured against a different yardstick than those of previous decades. In 2026, NOAA adopted the Relative Oceanic Niño Index in part to account for that changing background state. Still, how much global warming is influencing ENSO remains one of the field’s open questions.
Present tense
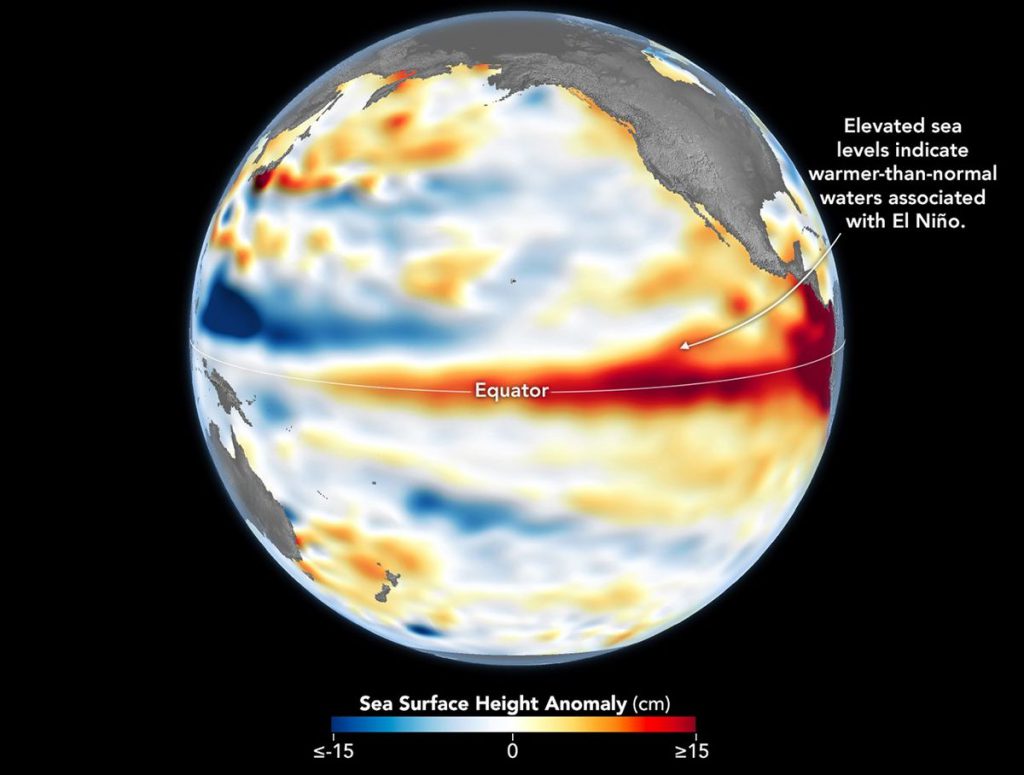
In December 2025, the ENSO team at NOAA’s Climate Prediction Centre noticed something building beneath the surface of the tropical Pacific. It wasn’t yet visible in the numbers everyone tracks first – sea-surface temperature was still unremarkable – but deeper still, a slow accumulation of warm water was spreading east along the equator. “One of the biggest clues that an El Niño may be coming is the build-up of subsurface oceanic heat across the equatorial Pacific Ocean,” says Michelle. “We saw the heat increase begin in November/December 2025, and almost immediately, the prediction models started anticipating the possible formation of El Niño for mid-2026.” By the time NOAA issued its December outlook, the odds had already shifted – El Niño was now more likely than a neutral or La Niña state.
“We do not always have that much lead time – it really is only with the stronger El Niños do we potentially see them coming well in advance,” she says. “Weak to moderate El Niños are often only anticipated a few months in advance, if at all.” The 2026 event, from the very start, had the signature of something big, which is precisely why the team caught it as early as it did.
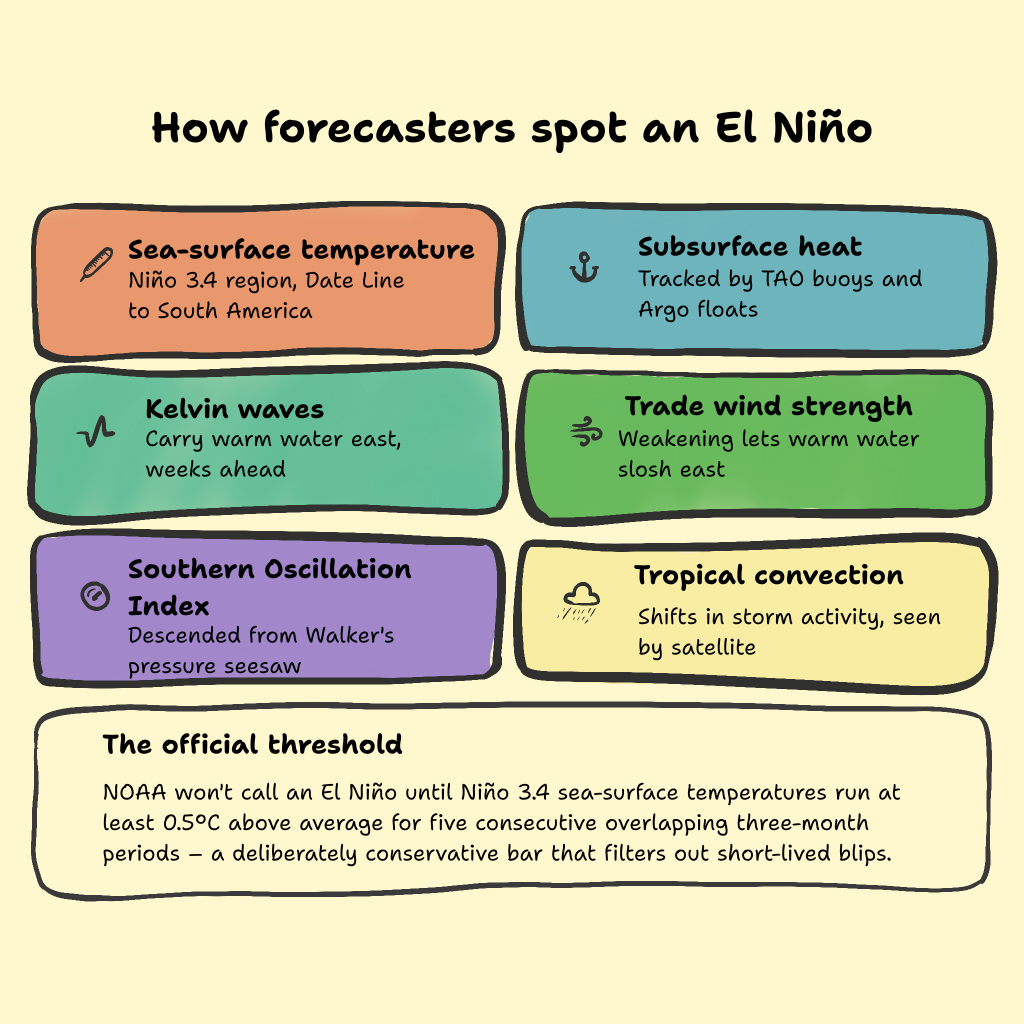
The UK Met Office has gone as far as saying that it’s now “very likely” that 2027 will end up the hottest year on record – the extra warmth from the ocean taking time to fully surface in global temperatures. Below-average monsoon rains have already been recorded across India this year, and Atlantic hurricane activity has been suppressed.
“Riding on the background ocean warming signal, [it] is predicted to be one of the strongest El Niños we have ever recorded,” says Roxy. Adam estimates that climate change may be adding roughly half a degree Celsius to the event’s warmth.
‘El Niño is never boring. Every event is different and distinct in its own way’
Researchers are already looking for new tools to improve forecasting. Both Roxy and Adam point to artificial intelligence and machine learning as the next major shift – not necessarily as a replacement for physics-based models, but as partners to them. “AI methods have been shown to make more skillful weather forecasts than traditional models,” Adam says. “I wouldn’t be too surprised if they eventually change some conventional approaches in seasonal prediction too.” Ravi imagines a hybrid future, with machine learning embedded within physics-based models, improving the parts of the system that scientists still struggle to represent accurately.
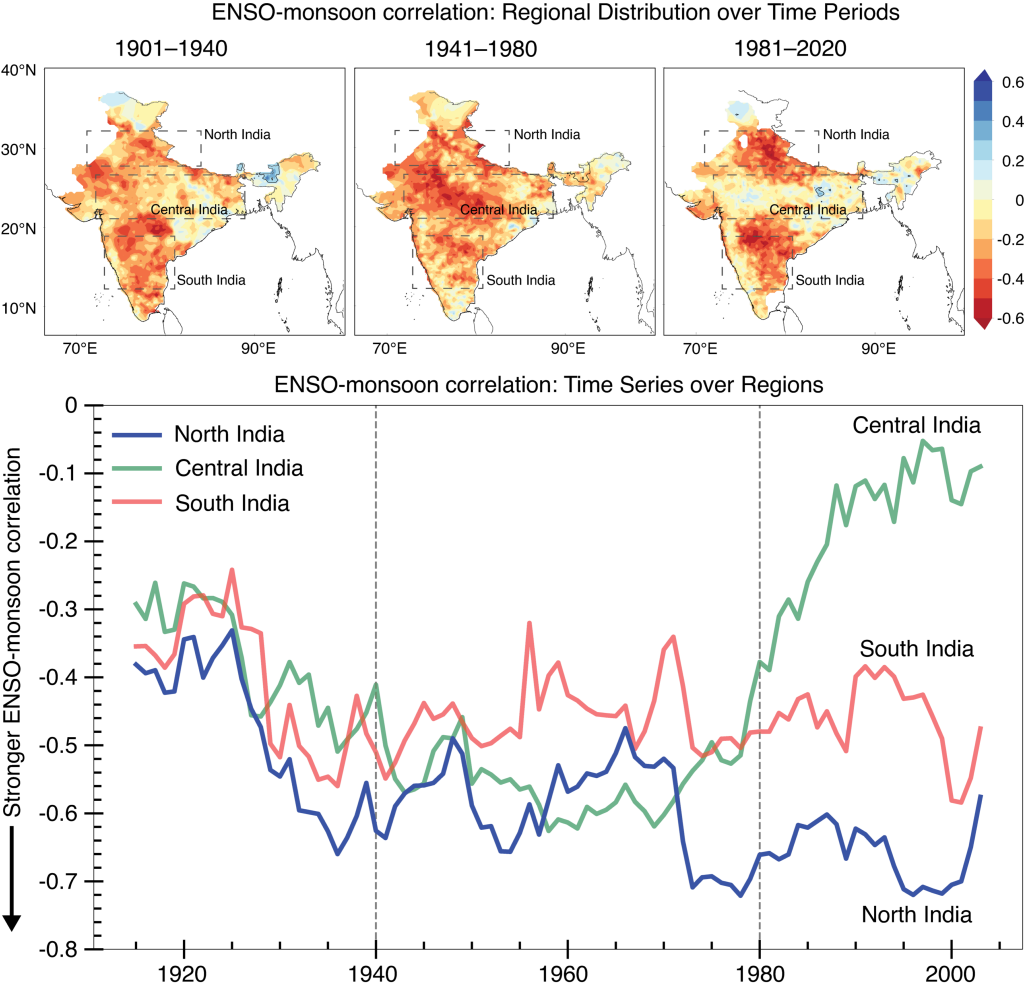
Predicting whether an El Niño will form is no longer the only question. “The more relevant question is how it will affect rainfall, heat, crops, reservoirs, health, fisheries, and ecosystems,” says Roxy. That shift has forced researchers to look beyond the Pacific, toward interconnected systems such as the Indian Ocean, which can store heat, reshape atmospheric circulation, and influence weather long after Pacific anomalies begin to fade. Roxy’s own work suggests that the familiar relationship between El Niño and India’s monsoon is no longer uniform – they show that it strengthens over the north of the country, holds roughly steady in the south, and weakens over central India, where local weather calls its own shots.
Underneath all of it sits the same challenge that has troubled the field for more than a century: seeing what lies beneath the ocean’s surface. Even with satellites, Argo floats, and a buoy network stretching across the equatorial Pacific, scientists are, in a sense, still chasing warm water through an impossibly vast and murky system.
On the upside, they are no longer running fully blind. A century of observations, buoys, satellites, and models has turned El Niño from a mystery that revealed itself only in hindsight into something humanity can watch build – imperfectly, incompletely, but at least in time to act.
As for the phenomenon, it continues to beguile the scientists who study it. “El Niño is never boring,” Michelle says. “Every event is different and distinct in its own way.”
(Edited by Ranjini Raghunath