A 2016 Indo-UK monsoon experiment collected a detailed set of data that is still being analysed
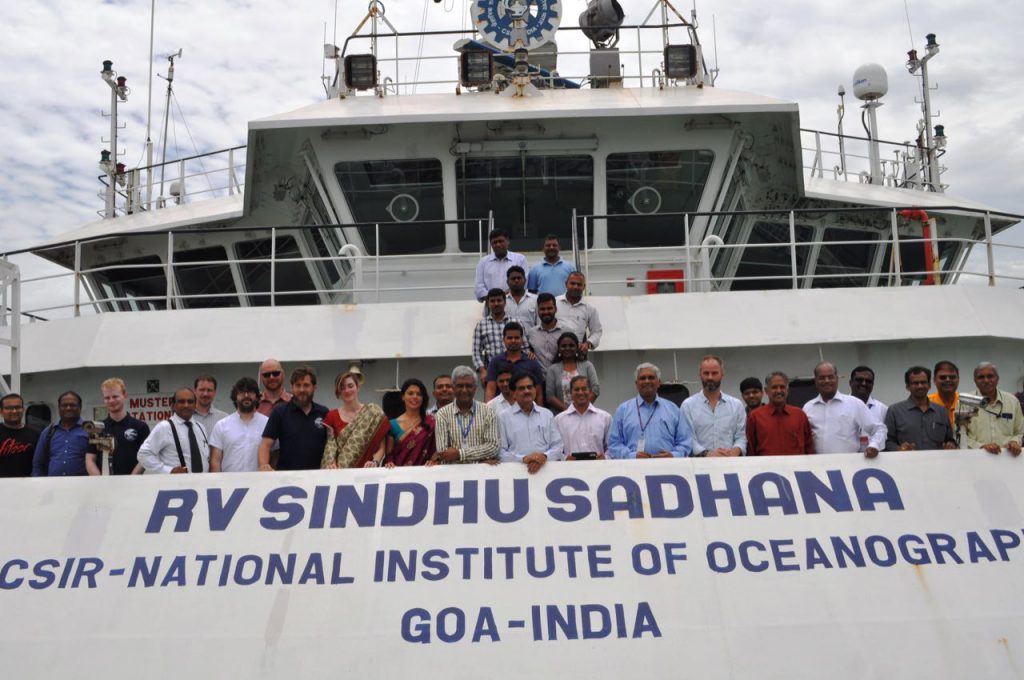
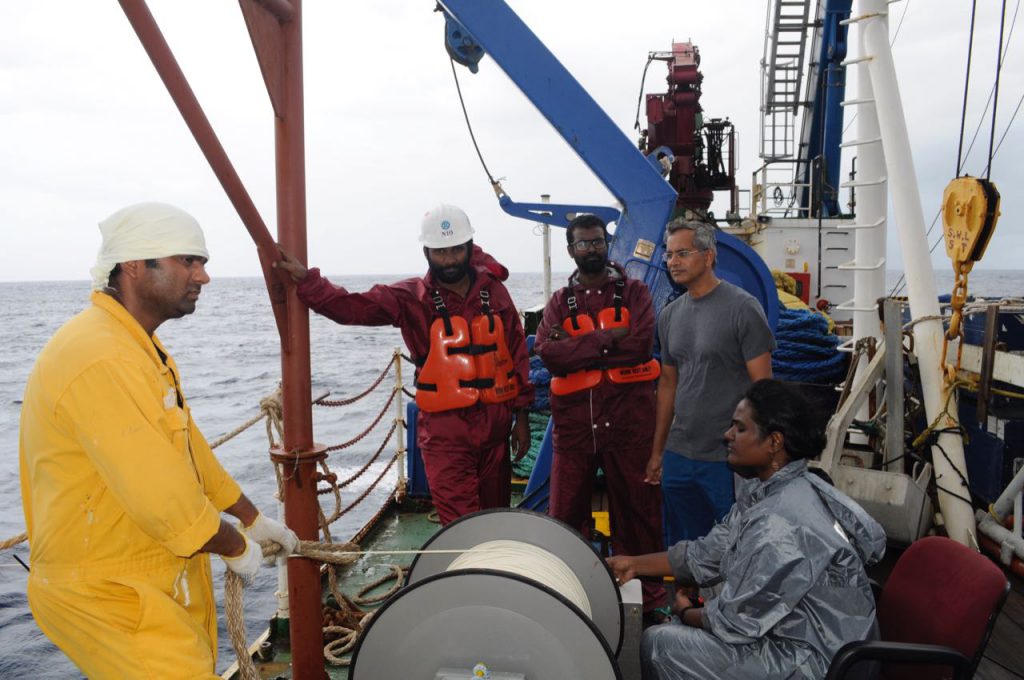
On 27 July 2016, the oceanographic research vessel Sindhu Sadhana sailed back to Chennai through terrible weather after a month at sea in the southern Bay of Bengal. Field experiments in the ocean are often risky and challenging during the monsoon because conditions can be very severe – winds, currents, and waves can rock the ship. This makes deploying instruments and collecting data hard, also because researchers can become severely sea-sick and unable to work. Operations sometimes have to be cancelled if there is a risk to life and property; it can all be quite overwhelming. But this cruise – for the Bay of Bengal Boundary Layer Experiment (BoBBLE) – hadn’t been like that at all.
It was, so to speak, smooth sailing. The Sindhu Sadhana carried 24 scientists from eight institutions in India and the UK, its captain and crew, and an exciting range of sophisticated instruments and equipment. News reports announced that BoBBLE would use “underwater robots” and a state-of-the-art aircraft to help predict the monsoon. They had had around three weeks of calm weather, and nearly everything in the 11.3 million dollar project went according to plan, even with an unexpected two-day delay (because a crew member on the ship fell ill and had to be picked up by the coast guard and taken back to land for an emergency surgery) and extremely choppy weather during the last week on their return – weather in which an Indian Air Force plane with 29 people on board disappeared over the Bay without a trace.
“It was an extremely – and unusually – successful cruise,” says PN Vinayachandran, a professor at IISc’s Centre for Atmospheric and Oceanic Sciences who led the fieldwork, with some excitement. “We have the best possible data! That’s the main contribution from that experiment – we have a data set from the southern Bay of Bengal that covers a 700 km-long section over a period of one full month. We measured almost anything that we could, and it’s the most complete sampling of that part of the ocean that I’ve ever seen in my career.”
Why focus on the Bay of Bengal?
The goal of the experiment was to learn more about the Indian monsoon. This is important because it affects the lives of people in India and neighbouring countries like Pakistan, Bangladesh, Myanmar, Sri Lanka, and parts of China. Being able to forecast weather accurately could have significant consequences for agriculture as well as minimising damage to property and disruption of people’s lives in the event of extreme weather.
The Bay of Bengal plays a crucial role in controlling the weather systems that make up the South Asian summer monsoon, which brings rain to India between May and September. Sea surface temperature (SST) is a key parameter in air-sea interactions that lead to the monsoon, and Why focus on the Bay of Bengal? therefore determining SST is important for monsoon modelling. SST is influenced by various factors, including radiation and exchange of heat with the atmosphere. And a particular occurrence in the Bay of Bengal – large amounts of freshwater being brought in from the Ganga and Brahmaputra rivers, as well as from heavy rainfall over the mountains of Myanmar, which receive the heaviest rain during the monsoon and form the eastern boundary of the Bay of Bengal – has a significant effect on SST in the area. As Eric A D’Asaro, an oceanographer at the University of Washington, told the BBC in an interview: “Freshwater inputs from both rivers and a large amount of rainfall make the Bay of Bengal a rather unique place, and that is not properly being taken into account in the monsoon forecast models.”
The Bay of Bengal plays a crucial role in controlling the weather systems that make up the South Asian summer monsoon
How does freshwater make a difference to the ocean in that region? The influx of freshwater into the northern part of the Bay dilutes the salinity of the sea water: while the mean salinity of the ocean is 35 grams (g) of salt for every litre of water, in the northern part of the Bay, this number can be as low as 20 g per litre (whereas in the rest of the ocean, changes in salinity are only in decimal places, Vinayachandran says). This creates a thin, lighter layer of water on the surface that absorbs heat and evaporates quickly. Researchers with the Ocean Mixing and Monsoon (OMM) Experiment reported finding a “sharp separation” between river water and seawater on scales ranging from 100 m to 20 km. Elsewhere, during the monsoon, strong winds cause the warmer surface layers to mix with the colder layers below, slowing down this process. But in the Bay of Bengal, the freshwater layer appears to act as a barrier to mixing, and therefore doesn’t cool down. The temperature remains rather high at a threshold of around 28°C even during the monsoon, which is conducive to convection.
Bobble Begins
Vinayachandran, who joined IISc in 1999, and participated in a national monsoon experiment called the Bay of Bengal Monsoon Boundary Layer Experiment (BOBMEX) that year, says, “That was the first cruise where we were able to capture data in the northern part of the Bay showing the low salinity layer. After that, we learned that we also need to look at the southern part of the Bay, where very interesting things were happening. I was very keen on this because oceanographically it is a very dynamic region.” The next such experiment in the Bay of Bengal was in 2009, another national programme, which took measurements in the northern and southern parts of the Bay. The weather was so bad that in some instances, data simply couldn’t be collected. They had to shift from their chosen location and start over, leading to gaps in the data. A similar experiment was repeated in 2012.
The next opportunity for fieldwork in the region came in the form of funding from India’s Ministry of Earth Sciences and the UK’s Natural Environment Research Council (NERC). It took a year of planning before BoBBLE was carried out in 2016. “A lot of technological development had happened between 2009 and 2016,” says Vinayachandran, and this was one of the main contributions from the UK universities. The “underwater robots” the media had referred to were gliders provided by the University of East Anglia that could be deployed and monitored electronically instead of manually, and could provide more data more frequently. They were configured in an L-shaped pattern using which the effect of currents on temperature and salinity in the region could be measured.
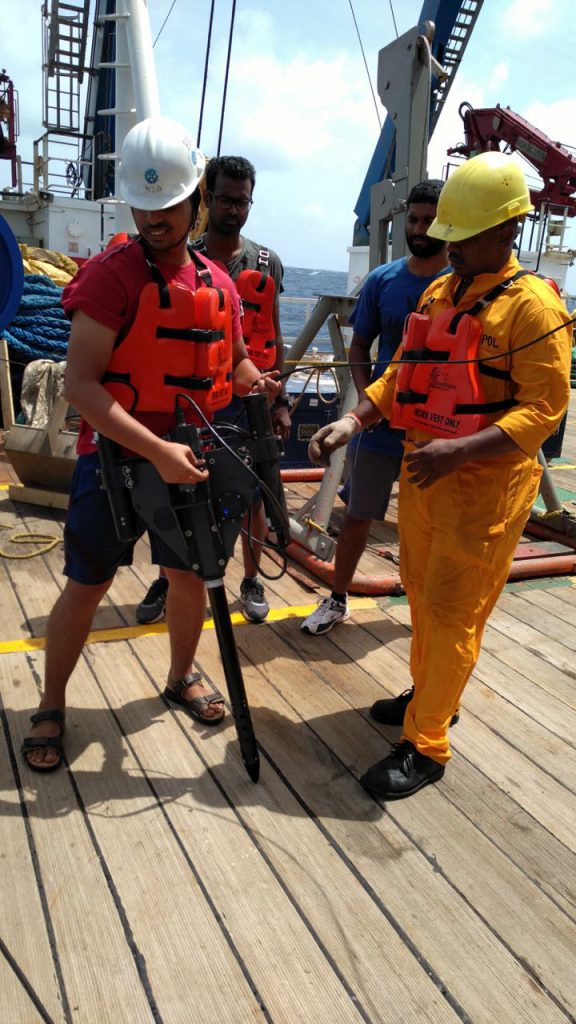
That wasn’t all. Vinayachandran says, “We had near-perfect measurement of air-sea fluxes taken with a pair of automated weather stations, and one eddy covariance measuring system. That’s the best measurement you can get for air-sea fluxes. Then we had a time series at one location, where we measured profiles continuously every three hours over a period of ten days. So we had turbulence measurements using a vertical microstructure profiler, which allowed us to calculate all the mixing happening. We had an instrument called Underway Conductivity Temperature Depth Profiler (uCTD) which you can use while the ship is running to measure the temperature profile.” Vinayachandran counts seeing the first profiles of the region from the microstructure profiler and uCTD – which he was using for the first time – as one of the most memorable moments of the trip.
One major new finding was that the effects of freshwater are seen in the southern Bay as well, creating a barrier layer
Another exciting moment he refers to has to do with the large Facility for Airborne Atmospheric Measurements (FAAM) aircraft that was used in the experiment, which he describes as being “as big as a passenger aircraft but instead of the rows of seats on either side it is fitted with instruments”. There was one location, soon after the trip began, when the aircraft flew over the ship and took simultaneous measurements at the same location. “That gave us the opportunity to sample all the way from the top of the atmosphere, to the air-sea interaction, all the way down into the ocean,” he says.
What have we learned from BoBBLE?
The results of the experiment were published in the American Meteorological Society journal in 2018. And analysis of that data is still underway. One major new finding was that the effects of freshwater are seen in the southern Bay as well, creating a barrier layer – although of a lesser intensity than in the north. Another achievement was being able to study a very strong current called the Southwest Monsoon current, which brings in heavy, cooler, saltier water from the Arabian Sea into the southern part of the Bay, and is crucial to maintaining the salinity level in the Bay. “Since it is heavier, when it comes into the Bay it slides below the freshwater layer, and has a core of high salinity water. We had known that such a core exists, but never knew its structure. We now have the first picture of that high salinity core – what its depth is and how it varies as a function of time,” says Vinayachandran.
The BoBBLE team was also able to capture data on the structure and diameter of this current, and its interaction with a cold dome that develops in the Bay known as the Sri Lanka Dome, which is associated with upward movement of cooler water from below. They were able to measure this movement, and document how the Southwest Monsoon current acts as a limiting boundary at the dome, isolating it from the high salinity water coming in from the Arabian Sea.
All of these features help understand oceanography essential to SST (including how much radiation is absorbed by the mixed layer, contributing to SST), productivity in the ocean, oxygen distribution, carbon cycling, and other processes. “We had simultaneous measurements of all the processes contributing to SST,” says Vinayachandran, “This has never been done before. This was our best achievement. Using careful calculation we have been able to show that ocean dynamics is very important for SST. This is key info that will go into models that will predict monsoons.” This last aspect, he says, will soon be submitted as a paper for publishing, and is the biggest direct contribution to understanding the monsoon.
The intense one-month cruise saw participation from researchers at the University of East Anglia in the UK, IISc (where Vinayachandran has a team of about 13 people – students, project staff and project associates) and other institutions, and had material and logistical support from a range of players, including the National Institute of Oceanography in Goa, which provided the ship, the Indian National Centre for Climate Information Services (INCOIS), Hyderabad, the National Institute of Ocean Technology (NIOT), and the Ministry for Earth Sciences. “Without support from so many fronts it would not have been possible to do this,” says Vinayachandran.
To read more articles in our series on the monsoon, click on the following links:
Sulochana Gadgil: A Lifetime of Monsoon Research
MONTBLEX: India’s First Major Monsoon Experiment
Interview with Syed Ameenulla: ‘Ours was a small group, like one family’
What an Adivasi Village in Chhattisgarh Can Teach Us about Sustainable Development
Decoding the Signatures of Monsoons Past in Fossils and Genes
Why Knowledge Isn’t the Barrier to Water Conservation
Chanchal Uberoi on Monsoon Melodies