An interactive climate change calculator from IISc reveals the path we can take to ensure that global temperatures are kept in check. It also shows us the path to disaster
On a sunny spring afternoon at the Rose Garden in the White House, the US President Donald Trump made a sweeping proclamation. “We’re getting out,” he declared, referring to his intention of walking away from the Paris Agreement, which the US has not only signed, but also ratified. As part of the agreement, the US, the biggest carbon polluter in history, has promised to voluntarily cut greenhouse gas emissions by 26% to 28% in the next few years. If it reneges on its pledge, what would be the consequences for the global fight against climate change? There is no straightforward answer to the question, but we now have a climate change calculator to help us understand the repercussions of such a move. It has been developed based on research by Rajiv Kumar Chaturvedi, Senior Researcher at the Divecha Centre for Climate Change, and his collaborator Jeremy Woods from Imperial College London in the UK.
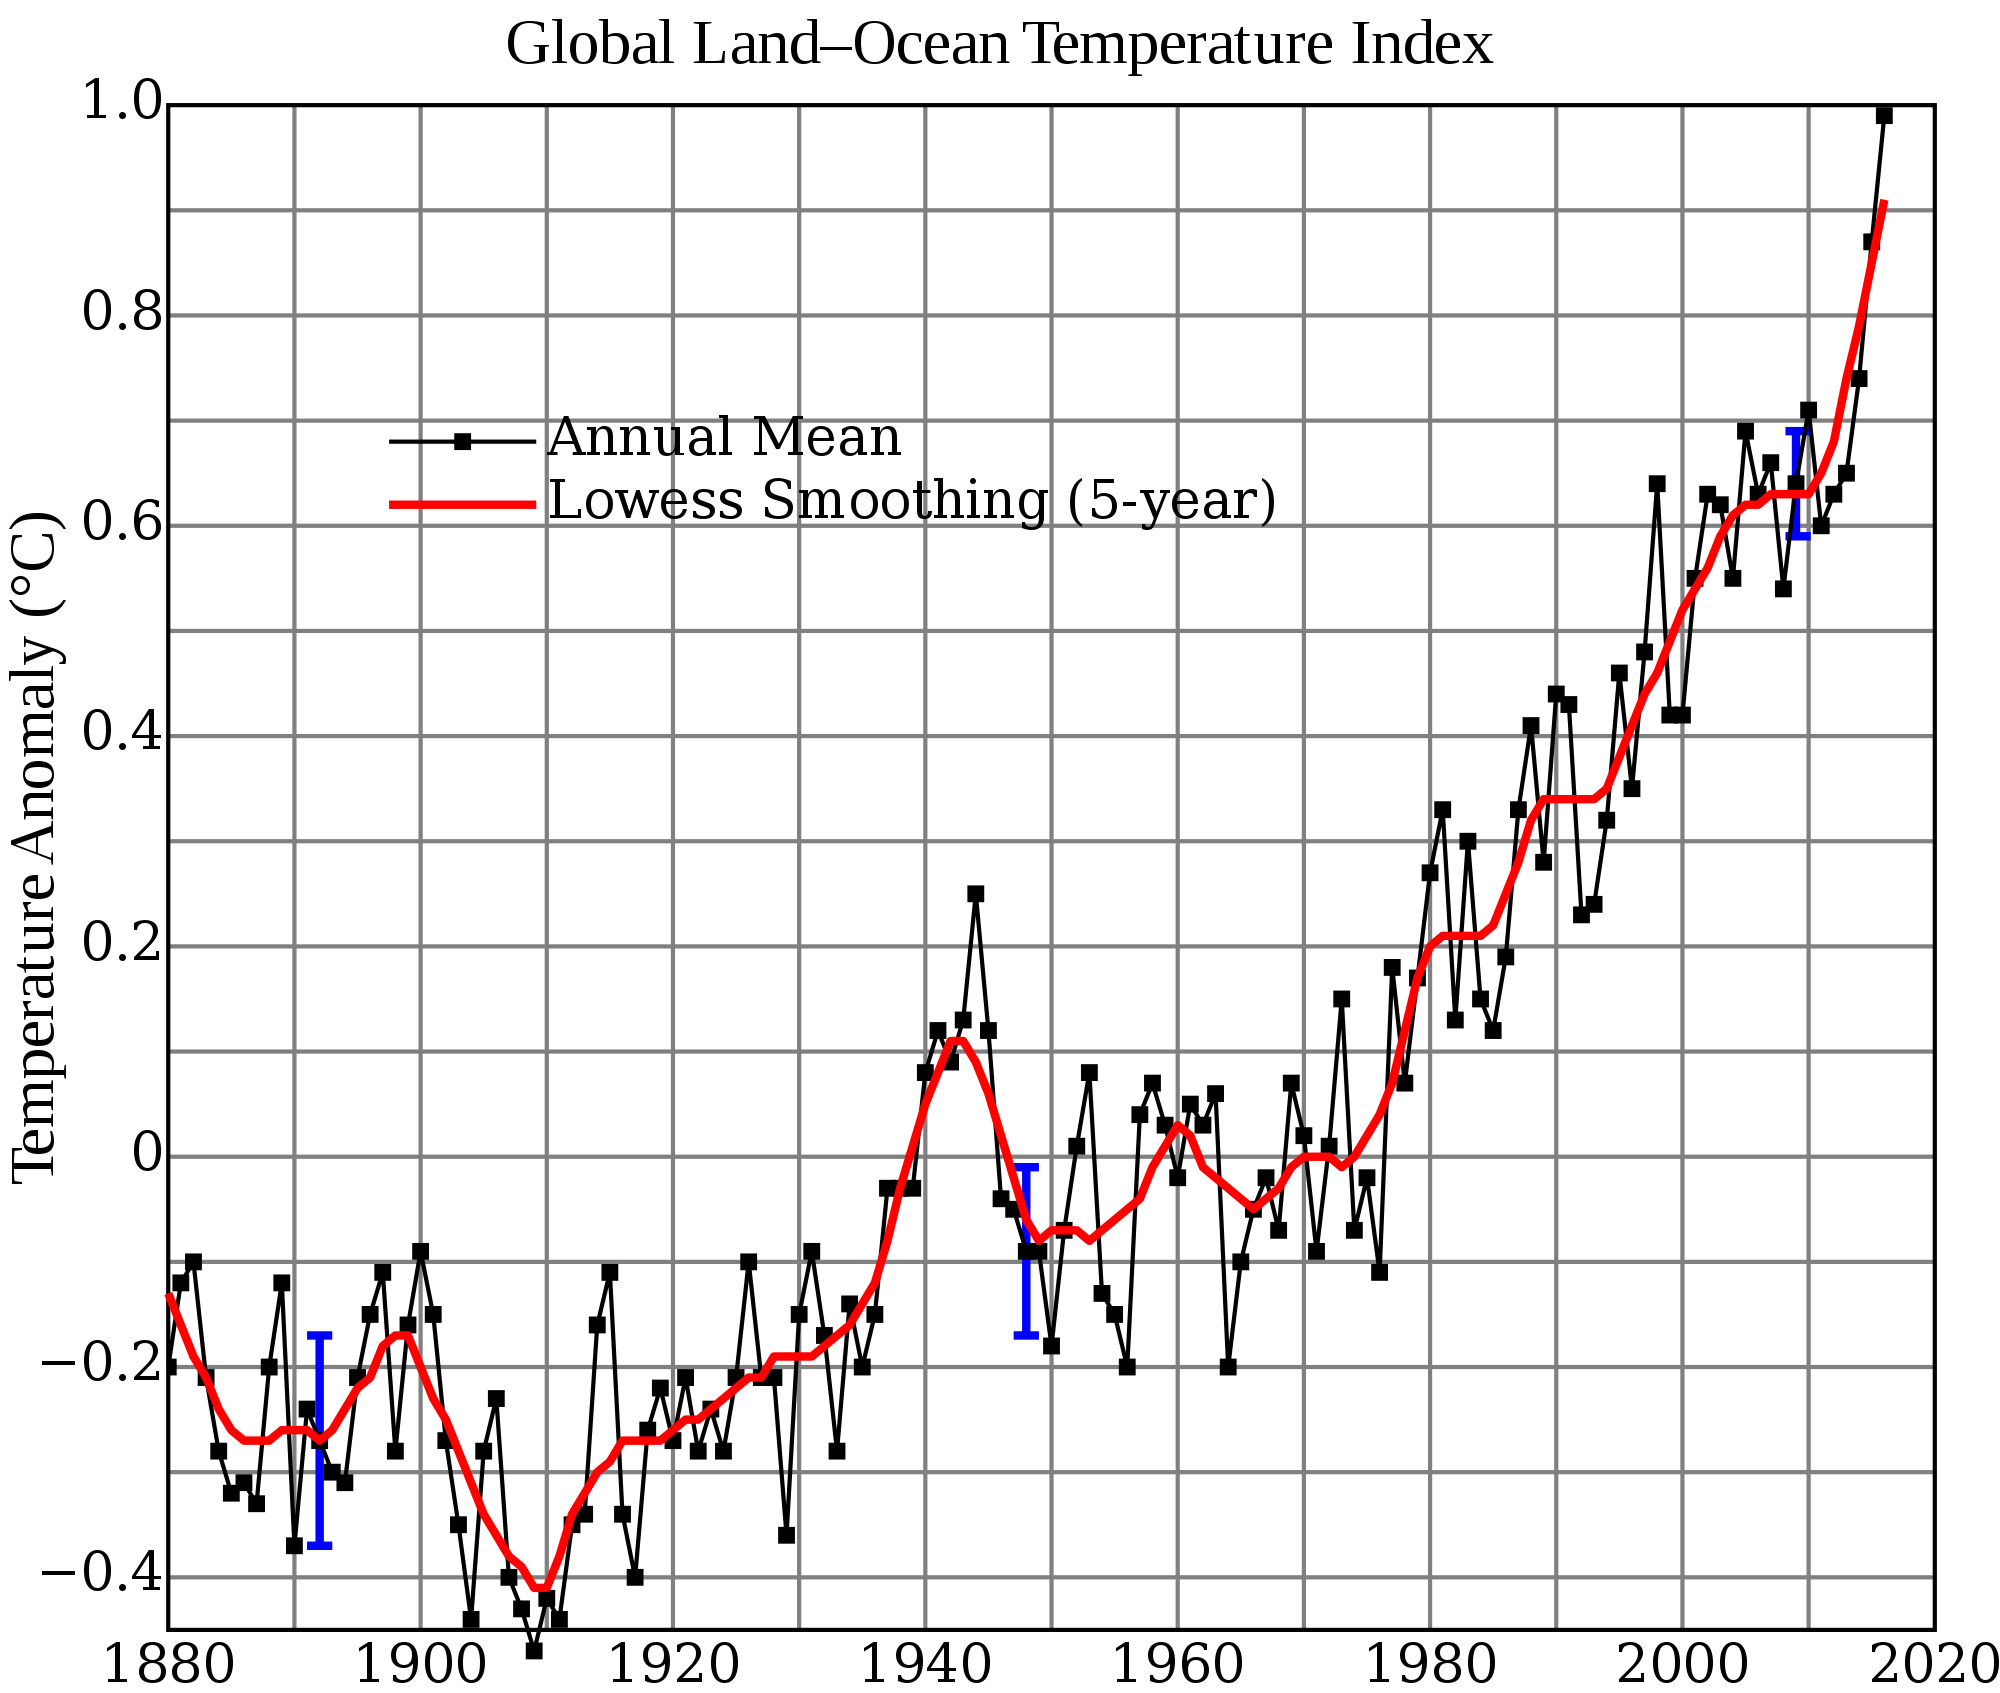
Since 1880, the average surface global temperature has increased by at least 0.85°C, and two-thirds of this warming has occurred since 1975. The effects of the change in temperature are already evident: sea levels are rising, sea ice and glaciers are melting, heat waves are becoming more frequent, and core ecological processes are being disrupted. And this is just Act One of the unfolding climate change drama because of a phenomenon that scientists call climate inertia – the delay in the earth’s response to its warming.
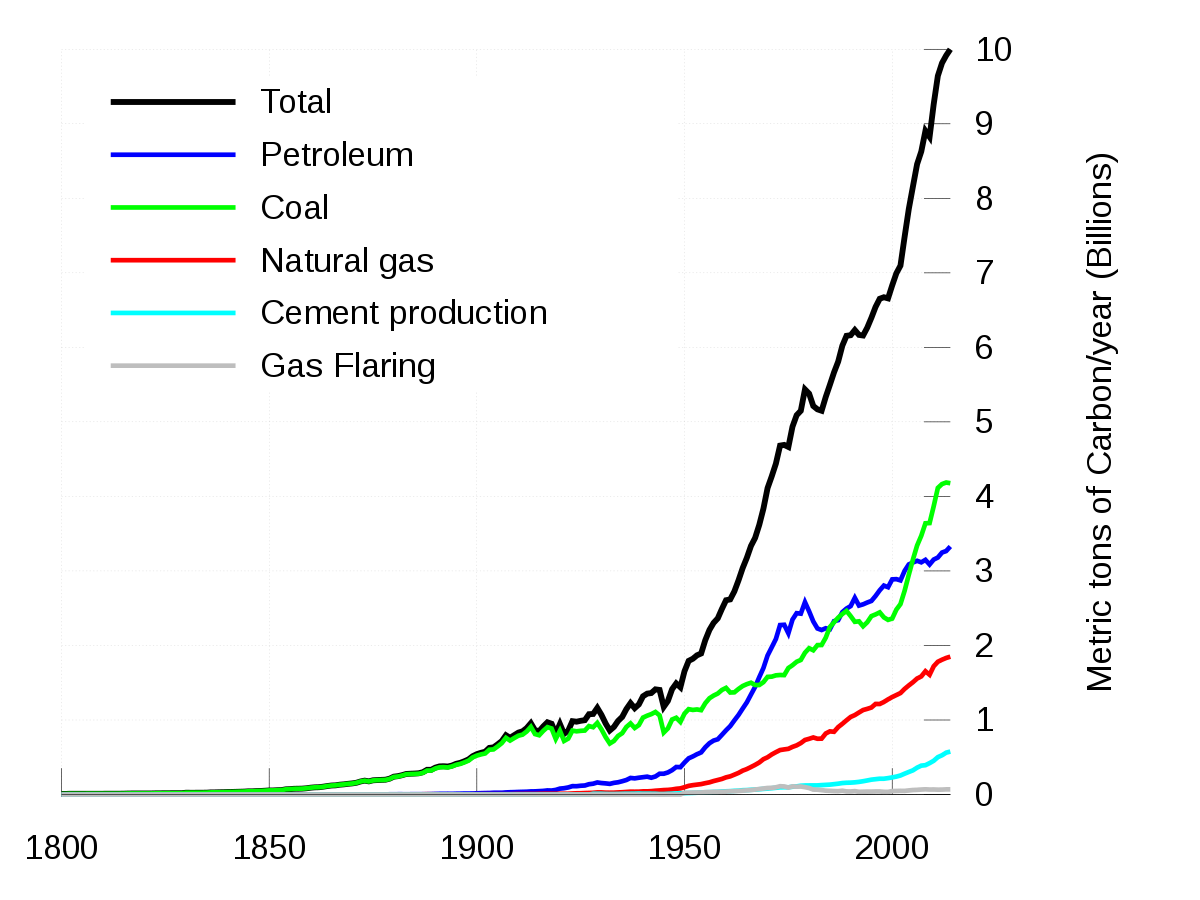
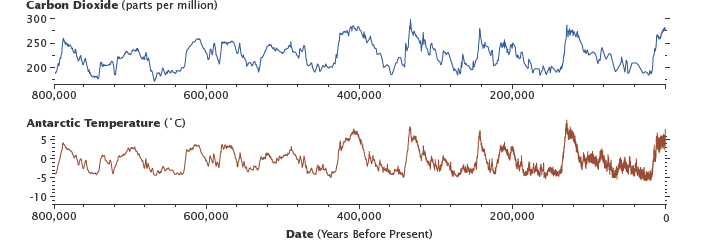
The earth’s temperature has been and continues to be influenced by natural factors like volcanic eruptions and solar irradiance. But the main villain in the recent spurt in warming which began with the industrial revolution is carbon dioxide (CO2). CO2 – called a greenhouse gas because it traps heat in the earth’s atmosphere not unlike how glass traps heat within a greenhouse – is released by the burning of fossil fuels like coal, natural gas and petroleum, formed over millions of years from the remains of dead plants and animals.
This positive feedback makes CO2 a deadly gas, and the principal driver of global warming
Surprisingly, CO2 is not the most abundant greenhouse gas in our atmosphere. That honour goes to water vapour. However it is the increase in CO2 since the 1800s that has triggered the process of the warming of the planet. When the concentration of CO2 goes up, it unleashes a chain reaction of sorts. Besides its own contribution to the greenhouse effect, CO2 raises the humidity levels in the atmosphere due to evaporation from warming, which in turn amplifies the warming effect. The warmer temperatures melt ice on sea and land. Now this is a double whammy. Ice, being white, reflects most of the solar radiation that falls on it. The loss of ice increases the amount of incoming solar radiation absorbed which now gets trapped by the excess greenhouse gases. And when ice melts, it also increases the amount of water in our oceans, which in turn absorbs more heat. This positive feedback makes CO2 a deadly gas, and the principal driver of global warming.
The amount of CO2 in the atmosphere has increased from 280 ppm in 1750 to 406 ppm in the first half of 2017. And how much more CO2 and other greenhouse gases we pump into the atmosphere in the coming years will determine how violently the earth responds to warming.
As we prepare for an uncertain future, the burden of making decisions to cut CO2 emissions rests on the recommendations of policy makers and the political will of world leaders, leaders whose track record when it comes to fighting climate change has been sketchy at best. But on the evening of 12 December 2015, the world got an early Christmas gift when 195 countries came together in Paris and demonstrated a willingness to act on the impending global crisis.
The rare unanimity however comes at a price. As part of the agreement, each country determines its own emission target or NDC (Nationally Determined Contribution) which it will start to work towards meeting only in 2020. And unlike the Kyoto Protocol adopted in 1997, NDC targets are not binding and there is no central mechanism to enforce them.
On the evening of 12 December 2015, the world got an early Christmas gift when 195 countries came together in Paris and demonstrated a willingness to act on the impending global crisis
In spite of its drawbacks, the Paris Agreement has a lot riding on it. But what happens if countries treat NDCs as mere lip service, given the non-binding nature of the agreement? Or what if they meet their ambitious targets? Or what happens if a country backs out of the agreement, as the US is threatening to do?
In the absence of another earth in which to do experiments, climate scientists address these issues by performing simulations with the help of mathematical models. The simulations predict the likely scenarios for global temperature changes assuming different emission levels in the coming years.
John Burn-Murdoch and Pilita Clark of the Financial Times have taken this a step further. Using the work of Chaturvedi and Woods, they have designed the COP21 calculator, an interactive tool hosted on the newspaper’s website, to help us visualise how global temperatures could increase from what it was before the dawn of the industrial revolution. The virtual device is called the COP21 calculator after the official name of the Paris Climate Change Conference: the 21st Annual Meeting of the Conference of Parties – the countries that make up the United Nations Framework on Climate Change.

Chaturvedi, who has a long association with IISc (he got his PhD from the Centre for Ecological Sciences and was later the National Environmental Sciences Fellow at the Centre for Sustainable Technologies), visited Imperial College London in late 2015 to help develop the calculator. He had previously been involved in designing an online global calculator for the United Kingdom and Climate-KIC, an EU conglomerate working to mitigate climate change. He describes the global calculator as the “precursor” to the one developed by Financial Times. “We from IISc had developed three scenarios for temperature increase for the global calculator. I used its algorithms for this calculator.”
Using the work of Chaturvedi and Woods, they have designed the COP21 calculator, an interactive tool hosted on the newspaper’s website, to help us visualise how global temperatures could increase from what it was before the dawn of the industrial revolution
The COP21 calculator, which won the Royal Statistical Society’s Statistical Excellence in Journalism award in 2016, is aimed at anyone interested in climate action, especially policy makers and world leaders. For instance, it can tell them what the global temperature increase is likely to be in 2100 if all the countries live up to the pledges they have made, shown by the dotted lines in the bars representing the big countries. “It also tells us what the scenarios will be if the major countries do what they are capable of doing beyond the promises they have made and also what might happen if they don’t do anything,” Chaturvedi says. The best and the worst case scenarios for emissions of each country, he explains, take into account the size of its economy, its expected economic growth and population growth. “For instance, EU emissions peaked in the year 1979, but India will not be peaking in its emissions any time soon as India is a developing economy and has to grow. However, it is important that the new infrastructure is built with renewables and low carbon alternatives.”
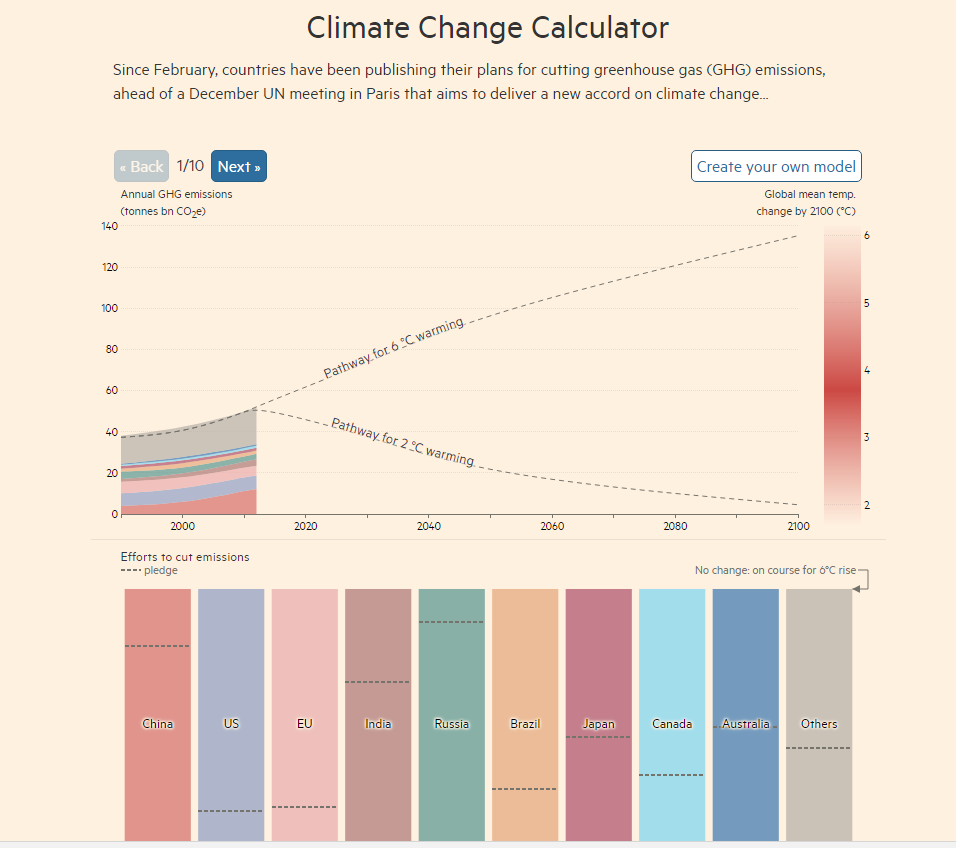
The calculator allows users to build their models by selecting emission levels in one of three time periods (2020-2030, 2030-2050 and 2050-2100). Built into these models are greenhouse gas emissions from 1870 to 2012 for various countries. According to its projections, if all countries choose to do nothing to cut their emissions, temperature increase will be about 4.7°C (at a probability of 50%) and could be as high as a whopping 6°C. The consequences of a temperature increase of 4°C to 6°C are likely to be disastrous for most life forms including humans. For instance, it could lead to deadly heat waves in many parts of the world, especially in the tropics. The intensity of these heat waves would make it impossible for humans to survive even for a few hours. “If ambient air TW [wet-bulb temperature] exceeds 35°C (typical human body skin temperature under warm conditions), metabolic heat can no longer be dissipated. Human exposure to TW of around 35°C for even a few hours will result in death even for the fittest of humans under shaded, well-ventilated conditions,” write Eun-Soon Im and her co-authors in a recent paper in Science Advances. “This will be an existential threat. It is not an option!” echoes Chaturvedi.
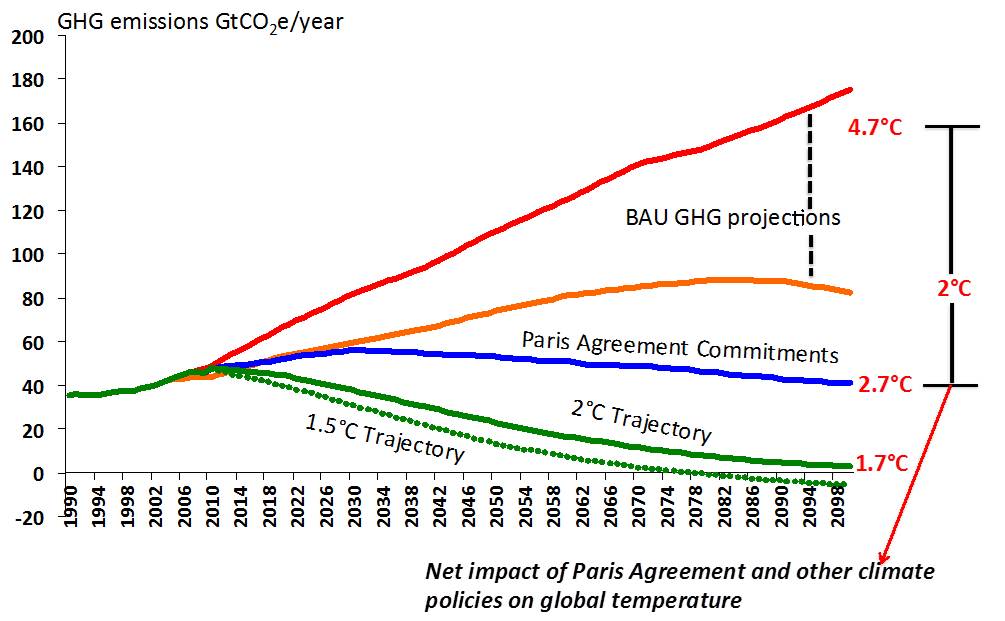
Climate scientists and world leaders are in agreement that we cannot allow a temperature spike of than more than 1.5°C, or at worst, 2°C. Holding global temperatures to this threshold is also the goal of the Paris Agreement. Even this temperature increase could have serious consequences for the planet, but may be the best possible outcome given how much greenhouse gas has already been pumped into the atmosphere. So will the pledges made at Paris help us keep the temperature increase to less than 2°C? Unlikely, according to the COP21’s computations. “Going by the current pledges, we may land up at around 2.7°C at the end of the century. There is a fringe chance that this might even go up to close to 4°C,” Chaturvedi elaborates.
It is aimed at anyone interested in climate action, especially policy makers and world leaders
However, the genial climate scientist is not entirely pessimistic. “These targets are for the period 2020-2030. Some countries like India have plans to meet their target before the end of this period. And after that period, if all countries go that extra mile, we can still keep the temperature increase to less that to 2°C. So we have some leg room.” But he ends with a warning. “One of the features of the calculator is that it graphically shows that the actions we take today are more important than the actions we take tomorrow.”
And oh, if the US chooses to be indifferent to its Paris pledge and long term climate goals, while all the major economies keep their promises, Chaturvedi’s model shows that the temperature rise will be greater by about 0.3°C.